I turn raw, messy data into powerful, decision-ready dashboards. With cross-industry experience, including auto sales, real estate, and business development, I deliver analytics that solve real business problems and reveal opportunities.
Happy Customers
Project Complete
Years of Experience

Recommended Offerings
I transform raw data into actionable insights through interactive dashboards built in Power BI, Tableau, and Looker Studio. With experience across automobile sales, real estate, and business development, I create data solutions that support smarter decisions and real business needs.
Dashboard & BI Solutions
Interactive Dashboard Development
Power BI • Tableau • Looker Studio
Build customized, interactive dashboards that turn complex data into clear insights.
Data Cleaning & Modeling
Organize and prepare data for accurate analysis using best practices in Power Query, SQL, and ETL workflows.
KPI & Business Performance Insights
Monitor performance, identify trends, and support better decisions across departments.
Industry-Focused Dashboards
Custom dashboards for automotive sales, real estate, and business development, built to match real operational needs.
Automation & Efficiency Tools
Excel & Reporting Automation
Automate repetitive tasks and streamline reporting using Excel, Power Query, and Looker/Power BI workflows.
Monthly/Weekly Reporting Systems
Automated Reporting Solutions
Generate monthly and weekly reports efficiently with error-free dashboards and scheduled refreshes.
Data Visualization & Analysis Tools I Use
SQL
Query and manage structured data efficiently.
Tableau
Create interactive dashboards and stories.
Power BI
Build real-time business intelligence dashboards.
Looker
Explore and model data collaboratively.
Power Query
Clean, transform, and prepare data for analysis.
DAX
Advanced calculations and analytics in Power BI.
Latest Projects
Take A Look at My Recent Projects
Here are some of my recent projects showcasing my work in Data Analytics. Take a look at the results I’ve delivered for my clients.
Game Insights Dashboard
I built a Game Insights Dashboard using Maven Analytics game data to highlight player activity, game performance, and leaderboard trends. The project showcases my ability to transform raw datasets into clear, actionable visual insights. I’m proud of how it turned out and always open to feedback for further improvement.
Based on the client’s requirements

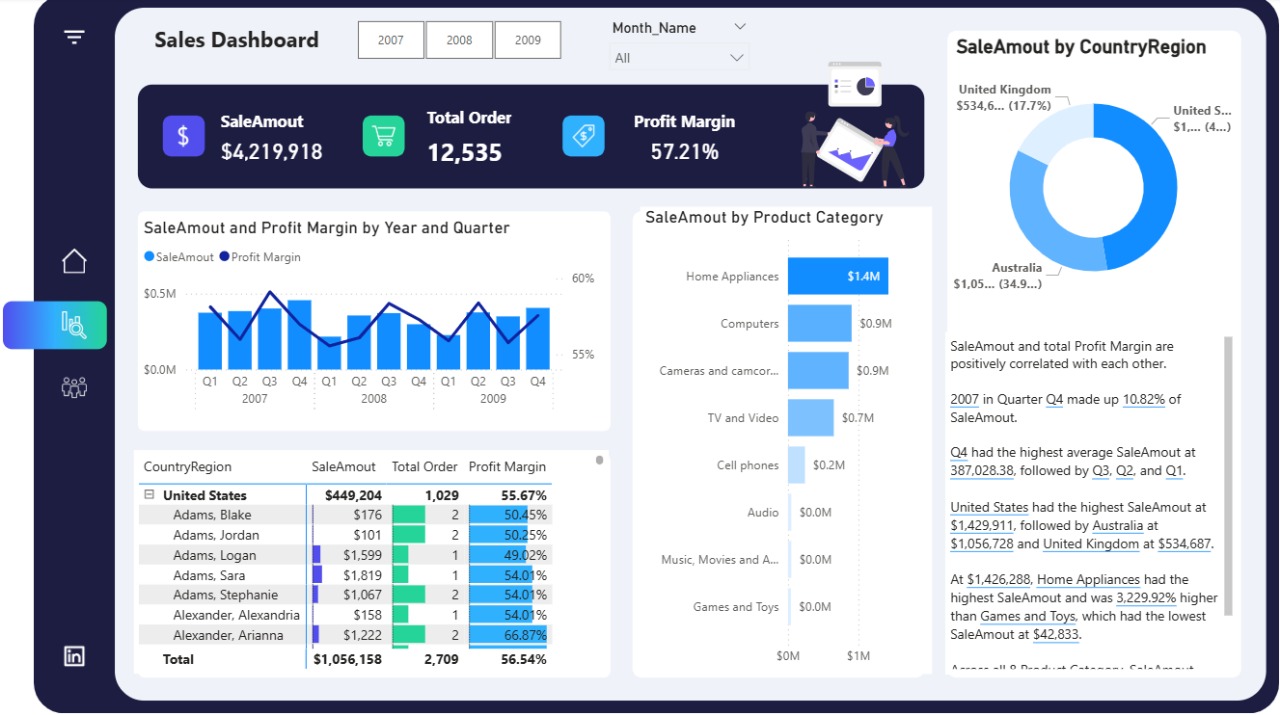
Power BI Dashboard
An interactive dashboard created using Power BI, integrating multiple datasets and applying tools like Power Query and DAX to produce clean, insightful visuals. It highlights my approach to building well-structured, data-driven reports while continuing to strengthen my Power BI proficiency.
Based on the client’s requirements

Why Work With Me
Extensive knowledge across multiple industries
Proven expertise in real projects
Hands-on experience delivering impactful results
Industry challenges handled with confidence
Practical solutions based on experience
Intuitive dashboards for easy use
Clear layout for quick insights
Visually appealing data presentations always
Organized design for effortless navigation
Simplified visuals enhancing decision-making
Actionable insights for smarter decisions
Data-driven strategies for growth
Focused analysis supporting business goals
Reports tailored to company needs
Insights enhancing operational efficiency
Quick turnaround for every project
Timely completion without compromise
Rapid results maintaining high quality
Efficient delivery exceeding expectations
Projects finished on strict deadlines
Clear guidance and training provided
Step-by-step instructions for understanding
Easy-to-follow learning materials offered
Simplified explanations for all users
Hands-on support during implementation
Need a dashboard?
Need a dashboard? Let’s build one for your business, providing affordable, fast, and fully custom-tailored solutions to visualize, analyze, and act on your data effectively.